LMI Trends, Imports, and Capacity Shifts
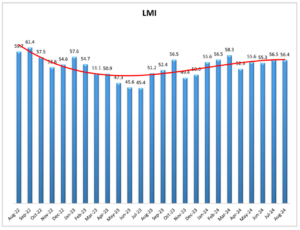
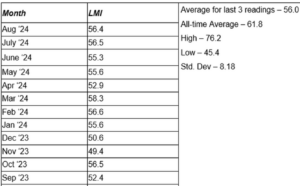
Today, we’re diving into the latest release of the Logistics Managers’ Index (LMI), where an interesting pattern of stagnation has emerged. Over the past four months, the overall LMI has barely moved, shifting by just a little over one point, with the current reading sitting at 56.4—5.4 points below the all-time average of 61.8.

Logistics Managers Index
So, what’s been causing the biggest shifts in the index this month? Inventory Levels, Warehouse Capacity, and Transportation Capacity are at the forefront. Both Warehousing and Transportation have been expanding at a faster pace, and Inventory Levels have moved from contraction into expansion territory for the first time since April. This is a significant shift for the industry.

Logistics Managers Index
Upstream vs. Downstream: The Spread Widens
One of the more interesting insights this month is the growing difference between upstream and downstream inventory levels. Upstream inventory—raw materials still requiring manufacturing—has moved into expansion territory at 59.4. Meanwhile, downstream inventory—finished goods closer to the end consumer—remains in contraction at 46.3.
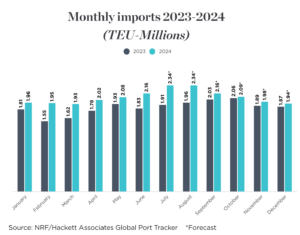
Why the discrepancy? It could be tied to the surge in imports we’ve seen in the past couple of months. According to the NRF’s Global Port Tracker, TEU (Twenty-foot Equivalent Unit) imports are estimated to have increased by 22.1% in August and are forecasted to rise by another 19.2% in September on a year-over-year basis. This growth is partly driven by importers pulling orders forward in anticipation of a potential ILA (International Longshoremen’s Association) strike at the end of September, which could affect East and Gulf Coast ports.

National Retail Federation
Port Activity and Freight Flow Shifts
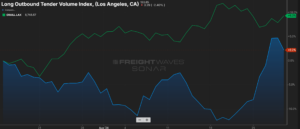
One noteworthy development is the West Coast import market share rising above 50% recently—the first time this has happened in over three years. For ports like LA and Long Beach, this increase in import activity has led to a significant spike in intermodal demand. Comparing this year to three years ago, when the West Coast import market share was similarly high, we’ve seen some major changes. Back then, truckload (TL) rejection rates in the LAX market were around 20%, whereas now they sit at just 4.3%, despite volumes being 17% higher than in 2021.
One theory for this trend is that the available TL capacity has increased by a staggering 79%, meaning goods being moved right now are less time-sensitive, which aligns with upstream inventory building. Outbound rail volumes are also growing faster than TL volumes, further supporting this theory.

What’s Next for Q4?
Looking ahead to the fourth quarter, we’ll be keeping an eye on how Warehouse and Transportation Capacity evolve, especially downstream. If these areas begin to slow or contract, we could start to see an uptick in Transportation Prices as time-sensitive goods become more critical, and rail options may not be able to keep up with demand.
As always, stay tuned to see how these trends unfold as we inch closer to the holiday season. Whatever the cause of the shifts—whether it’s the potential of a trade war, early signs of inflation subsiding, or a rate cut before the end of the year—these logistics changes will have a profound effect on freight flows in the months to come.
